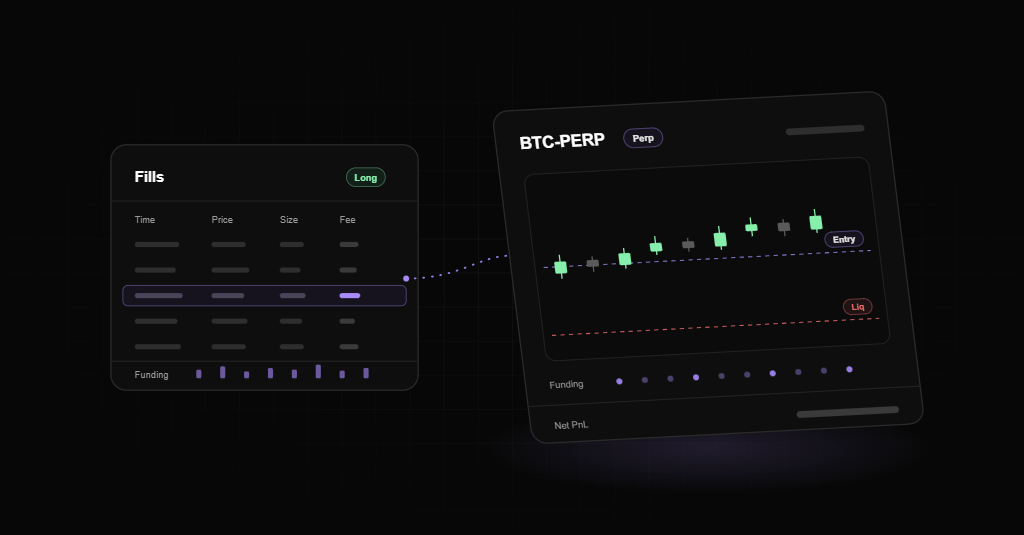
A perpetual futures journal records every fill of a perps trade along with the costs a spot journal never sees: trading fees, funding payments, leverage, and how far price sat from your liquidation price. The number you grade is net PnL, which is price PnL minus trading fees, plus or minus funding. If your journal only stores entry, exit, and size, it will tell you a different story than your exchange balance does.
This page walks through one perps trade from first fill to final number, so you can see what each field is for. For funding attribution methods and a full field checklist, read our guide to crypto futures journaling.
What makes a perps trade different to journal
A spot trade is simple to log. You buy, you sell, you pay a fee. A perpetual futures position has more moving parts:
- It's often built from several fills on the way in and several on the way out.
- It pays a trading fee on every fill, and the rate depends on whether you were maker or taker.
- It pays or receives funding at set times for as long as it stays open.
- It uses leverage, which sets your margin and your liquidation price.
Each of these changes the result, and each can be missing from a basic journal without you noticing. The chart says you won, and the balance moved less than you expected.
The five things to track on every perps trade
Fills, including partial fills
Log each fill as its own row: side, size, price, and time. A position you built with three entries and closed in two parts is five fills, not one trade with a single entry and exit.
Your average entry and exit come from the fills, so a single "entry price" field hides how you scaled. Each fill also carries its own fee, and a mix of maker and taker fills changes what the trade cost.
Trading fees
Trading fees are what the exchange charges to open and close. They scale with the notional value you trade, and taker fills usually cost more than maker fills. Adding to and trimming a position over and over raises the notional you trade, so it raises fees too. They're paid whether the trade wins or loses.
Funding
Funding is the periodic payment between longs and shorts that keeps a perp near the spot price. Depending on the venue it lands every hour or every few hours. You pay or receive it based on your position size at each funding time, so it grows with how long you hold.
Keep funding separate from trading fees. Fees tell you about execution: how often you trade and whether you pay up to get filled. Funding tells you about holding: how long you sit in a position and which side of the crowd you're on. Lumping them together hides which habit is costing you.
Leverage and margin
Record the leverage you used and the margin that backed the position. Two trades with the same chart and the same stop can have very different risk if one used 3x and the other used 20x. Margin mode, cross or isolated, belongs here too, since it decides whether a loss stays inside one position.
Liquidation distance
Liquidation distance is how far price would have to move against you before the exchange closes the position. As a percent:
liquidation distance = (entry price minus liquidation price) ÷ entry price, for a long
For a short, swap the order: liquidation price minus entry price, divided by entry price.
Log it at entry. If you add to the position or pull margin, log it again. A trade that came within a few percent of liquidation and still won is a risk event worth reviewing, even though the PnL looks good.
A worked perps trade, from fills to net PnL
These numbers are an example to show the math. They aren't real fills or a trade idea, and fee rates and funding vary by exchange.
A trader goes long BTCUSDT perps at 10x, scales in with two fills, and scales out with two fills. The example uses a 0.05% fee on every fill and two funding payments during the hold.
| Line | Detail | Amount (USDT) |
|---|---|---|
| Entry fill 1 | Buy 0.10 BTC at 60,000 | Notional 6,000 |
| Entry fill 2 | Buy 0.10 BTC at 59,800 | Notional 5,980 |
| Average entry | 0.20 BTC at 59,900 | Notional 11,980 |
| Margin at 10x | 11,980 ÷ 10 | 1,198 |
| Liquidation price | Example figure from the exchange | 54,500 |
| Liquidation distance | (59,900 minus 54,500) ÷ 59,900 | 9.0% |
| Exit fill 1 | Sell 0.10 BTC at 61,000 | Price PnL +110.00 |
| Exit fill 2 | Sell 0.10 BTC at 60,500 | Price PnL +60.00 |
| Trading fees | 0.05% of 24,130 total notional across four fills | -12.07 |
| Funding payment 1 | Paid while long | -4.80 |
| Funding payment 2 | Paid while long | -6.10 |
| Net PnL | 170.00 minus 12.07 minus 10.90 | +147.03 |
A few things stand out once it's laid out like this.
Price PnL was 170, but the account grew by about 147. Roughly 13% of the gross result went to costs, split almost evenly between fees and funding. A journal that only stores entry and exit would report 170 and leave you wondering why your balance disagrees.
The fees came from four fills. With one entry and one exit at the same prices, the notional and the fee would be about the same, so scaling didn't cost extra here. Adding and trimming many times in a session would.
Funding came from holding through two funding times. Hold through six and that line triples, while the fee line stays the same.
The 9% liquidation distance at 10x is worth writing down. If the same setup were taken at 25x, that distance shrinks to a few percent, and a normal wick could close the position before the stop.
How Hyerlo handles perps trades
Hyerlo is a crypto trading journal built around perps, and the trade above maps onto it field by field.
Getting trades in
Binance Futures connects through a read-only API key and syncs trades on its own. Synced trades can't be edited or deleted in Hyerlo, so the journal always matches the exchange. On paid plans, Bybit, Phemex, Hyperliquid, and Binance USD-M come in by CSV import. You can also add any trade by hand on the Trades page.
Partial fills
A manual trade is a list of order rows. Each row has its side, size, time, and price, and you add a row for every scale in or scale out. The footer shows the position size and what's still open. When the remaining size reaches zero the trade closes as a win, loss, or breakeven. On synced trades, the Orders panel lists every fill.
Trading fees and funding
The manual trade form has separate Transaction Fee and Funding Fee fields. On the dashboard, the Fees card shows your total fees split between trading and funding, so you can see which one is growing. CSV import rebuilds trades from fills and skips funding rows, so for imported trades keep the exchange's funding history at hand.
Leverage and liquidation distance
Exchanges generally don't include per-trade leverage in their trade history exports, and there's no separate leverage box on the manual trade form, so record leverage, margin mode, and liquidation distance in a tag or in the trade's note. A tag like "10x" or "near liq" lets you filter the Trades table later and see how those trades did as a group.
Reviewing the result
Each trade opens on a full chart with your entries and exits marked, next to its fills, fees, duration, MFE, and MAE. The dashboard adds PnL, drawdown, hit rate, and behavior widgets like streaks and overtrading. The calendar shows net PnL per day.
Hyerlo has no AI insights, no position calculators, and no trade replay. It records what happened and lays it out for review. The Base plan is free with manual entry, and autosync and CSV import start on Breakout. See pricing, or start at hyerlo.com.
Frequently asked questions
What is a perpetual futures journal?
It's a trading journal set up for perps. Along with entry, exit, and size, it records each fill, trading fees, funding payments, leverage, margin mode, and liquidation distance, and it grades trades on net PnL after all costs.
How do I calculate net PnL on a perpetual futures trade?
Start with price PnL from your fills, subtract trading fees on every fill, then add funding you received or subtract funding you paid. The result should match the change in your exchange balance from that trade.
Should I track funding separately from trading fees?
Yes. Trading fees come from how often you trade and how you get filled. Funding comes from how long you hold and which side you're on. Keeping them apart shows which habit is eating into results.
How do I log partial fills in a trading journal?
Record each fill as its own row with side, size, price, and time, all under one trade. Your average entry and exit come from those rows, and each fill's fee adds to the total cost.
Why should I record liquidation distance?
It shows how much room a trade had before the exchange would have closed it. Trades that won while sitting close to liquidation carry risk the PnL doesn't show, and tracking distance helps you spot leverage creeping up.
Which exchanges does Hyerlo support for perps?
Binance Futures syncs automatically through a read-only API key on paid plans. Bybit, Phemex, Hyperliquid, and Binance USD-M come in by CSV import on paid plans, and you can enter trades from any exchange by hand.